How to Use Google Analytics to Build a Useful Website Performance Report
Part 2 of a series on SEO reporting best practices
(ICYMI: Part 1)
Traffic data, found in Google Analytics, helps you quantify your site’s engagement level. Using this data, you can understand more than just how many users visit your site. Traffic data can reveal what information users find useful and help you prioritize optimizations to emphasize the right content for your audience.
The notion of “traffic” makes intuitive sense to people. You have visitors to your website; go ahead and count them. But the reality is that there are multiple ways to quantify traffic. Understanding the nuances behind what differentiates each type of traffic insight can help you ask better questions and unearth better answers.
Note – the metrics discussed in this article are available in Universal Analytics (UA), the data that Google will soon be sunsetting in favor of GA4, a newer model. We will be discussing the subtle but impactful differences between these two platforms in a later post.
Pageviews vs. entrances
Sessions and users
Engagement metrics
Understanding behavior with event tagging
Measuring conversions using goal completions
Your arsenal of e-commerce metrics
Sync with your CRMs
Caveat regarding traffic insights
Getting the most out of Google Analytics
Preparing for GA4
Pageviews vs. entrances
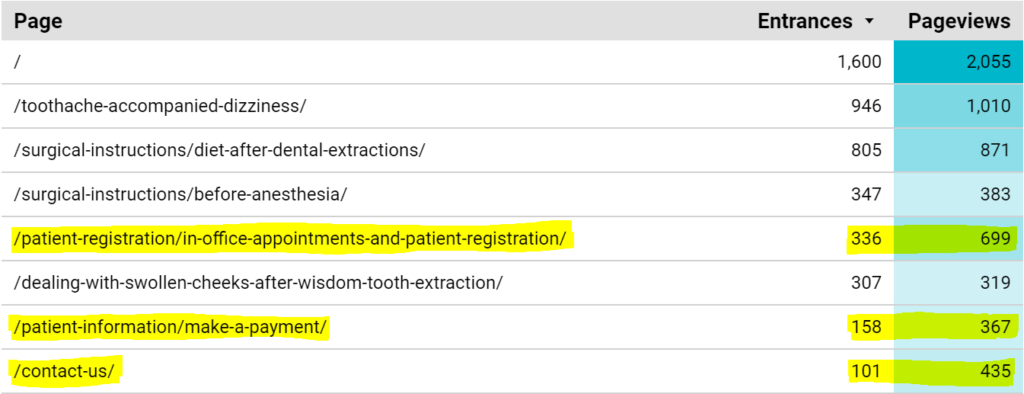
A pageview is, quite literally, a visit by a user to a specific URL on your site. Comparing the number of pageviews across your site tells you the number of visits to each separate URL.
Pageviews are a great measurement of existing performance and provide a data point that anyone can understand. However, pageviews only become actionable when combined with other metrics that provide context around the numbers.
Pageviews help understand which pages are consistently attracting users and helping them in their decision journey, regardless of how or why.
Entrances are a subset of pageviews. An entrance is the first pageview a user makes in a particular instance of visiting a site.
The utility of assessing pageviews and entrances can vary widely, and heavily hinges on understanding what pages you are looking at. Most businesses wouldn’t consider their “About Us” page to be a money page, but they may receive high numbers of pageviews from users trying to learn about your brand and form a decision.
Sessions and users
A user is a distinct individual to your site. A session is an instance of a user visiting your site. Both numbers are used to measure total site traffic.
It’s important to remember that a user can (and frequently does) have multiple sessions over time. While these metrics tend to be closely correlated, the number of users can speak to the size of your audience, while sessions can shed light on re-engagement patterns.
We frequently look for trends in sessions and users to identify whether a site’s audience is growing, shrinking, or stable over time.
It is important to consider both metrics alongside each other. Sessions dropping could be tied to a decline in the number of users, or a decline in repeat visits from an existing set of users. These two instances of session drops point to two very different problems.
If sessions drop while the number of users holds steady, you will see the number of sessions per user decline. This may indicate that something on your site is deterring users from making return visits or trusting your site.
Combining this with other data points can help you evaluate whether the issue lies with your messaging, branding, UX or how your product/service measures up with your competitors.
On the other hand, a decline in the number of users could point to an issue with your marketing campaigns, SEO, or PPC, preventing customers from visiting your site in the first place. If possible, the reason for this drop should be attributed to a specific channel, page, geographic region, etc. so that you can take the most strategic approach to optimize —and accurately quantify its effects.
Engagement metrics
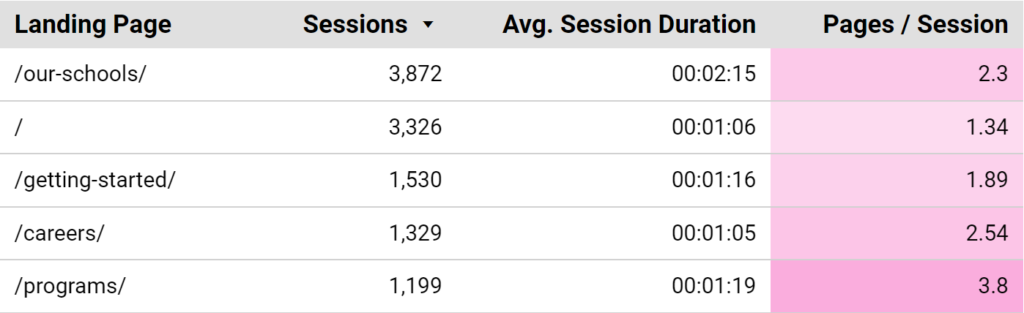
Two key data points for user behavior are average site duration and pages per session. Both data points showcase how deeply users engage with a website.
You can discover whether users gravitate towards a quick engagement with the site, whether they move quickly on pages and only engage with a few pages, or if they spend more time on more pages.
Usually, these behavior metrics will measure higher in e-commerce or highly technical industries, where visitors are trying to learn about products or complex concepts.
Higher is not always better, though. Suppose users spend excessive time on the site or click through tons of pages to find what they want. This could be the result of poor user experience or content mismatched by what the metadata promised.
Again, you must consider these behavior metrics together with other values, like sessions and users, to really understand what’s happening with your visitors.
Understanding behavior with event tagging
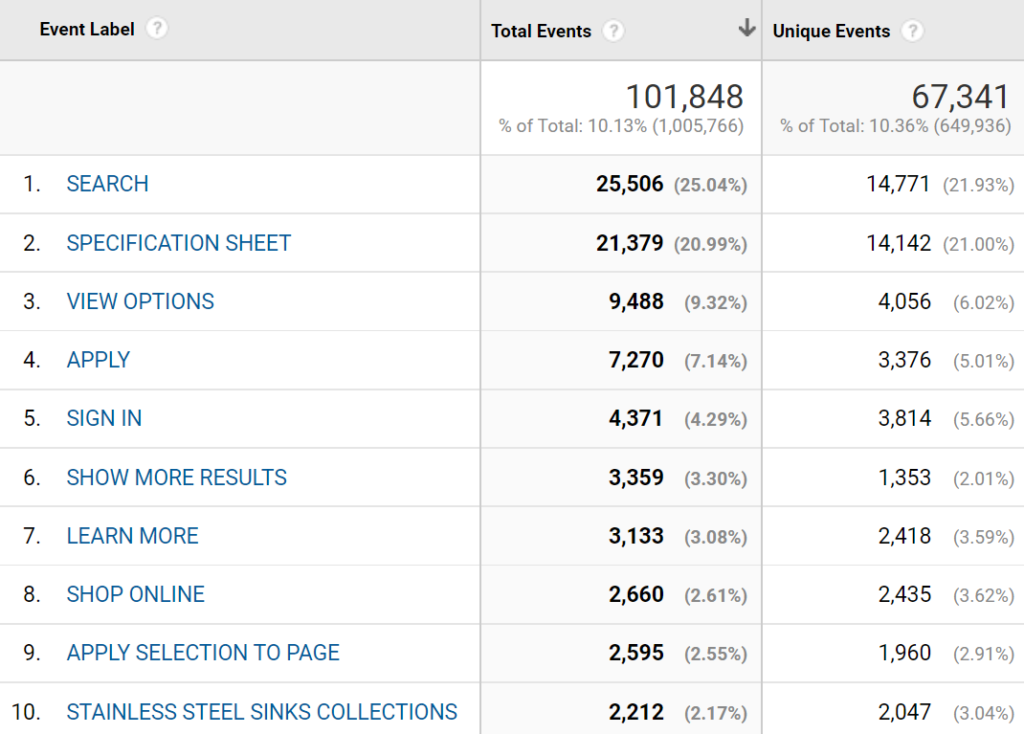
Event tagging helps you better understand how users interact with your pages, getting a bit more granular than just “what pages are they visiting.” An event occurs whenever a user interacts with any element of your site, including visiting a particular URL, loading an image, downloading an app, making a purchase, and more. You can track any number of these events on individual pages by tagging them in Google Tag Manager, and you can report on the number of events that occur in a particular amount of time.
The events you choose to tag drive the level of insight you’ll gain. For example, tagging form submissions, button clicks, and scroll depth can reveal detailed engagement insights that help identify pain points in the conversion process. One of the most common uses of event tagging is to A/B test calls to action, so you can ultimately rely on the one that consistently converts.
You also get to set the data parameters for each event you track. Say you’re examining e-commerce conversion; for every purchase, you may choose to track things like the item value and coupon codes used in conjunction with a particular event.
If high-traffic pages have very few clicks on whatever item you need to convert–calls-to-action, form submissions, etc.–you may have an issue with effectively driving users on a clear path to complete these actions. This would likely trigger your re-evaluation of the page’s layout and/or UX features.
Do you need improved heading text, more images, better navigation, or a change to another page feature? You may need iterative rounds of A/B testing to successfully optimize this page, but with each round, you learn more details about your target audience.
When you consider which events to tag, get granular. Events are a fantastic solution to answer discrete questions about user behavior.
Measuring conversions using goal completions
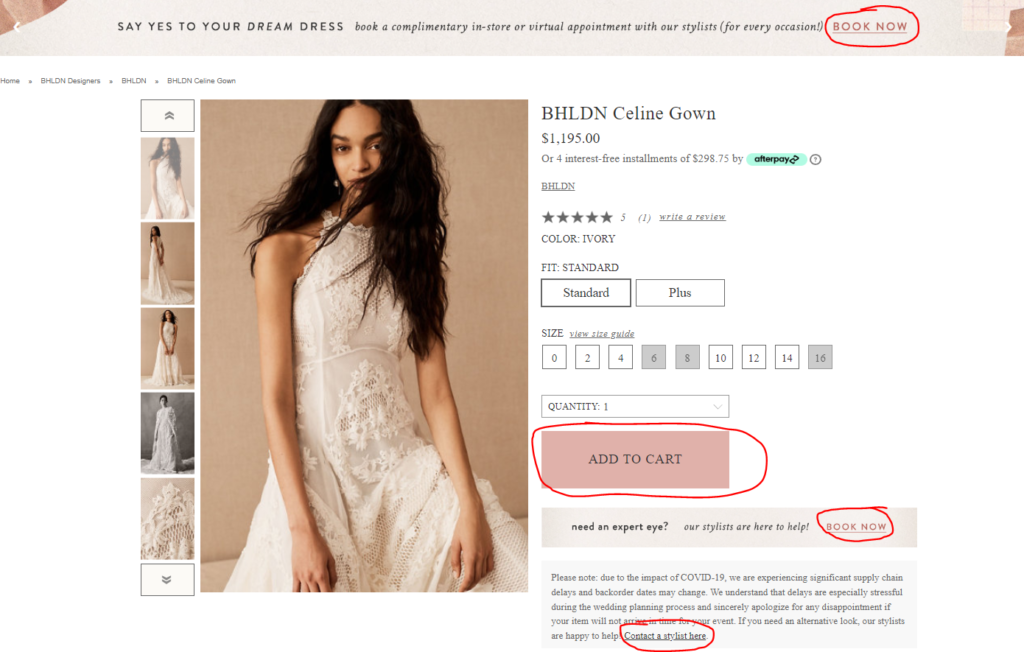
Goal completions help you track and optimize your conversion rate. Unlike events, goal completions are configured to measure activity that your company considers a “conversion”, such as a lead- or revenue-generating action.
A goal completion might be a specific button click, form submission, phone call, or even a “Thank You” page indicating that a user completed a form or made a purchase. You can measure the frequency of these goal completions on your existing web page, or as you deploy any new site campaigns or changes, including content, messaging, UX features, or calls to action.
You can use these metrics to assess the incremental value of your marketing efforts including your PPC, SEO, and more. You may evaluate goal completions and website changes side-by-side to understand how many conversions and leads were driven by these digital marketing strategies.
A helpful way to understand the difference between goal completions and events is that it typically takes several events to lead to a goal completion.
Your arsenal of e-commerce metrics
Anyone with an e-commerce site can speak to the dream of data that describes how much revenue is generated at each step of the customer journey, while reporting detailed variables around products, pages, demographics, and other audience characteristics. The deeper this reporting, the more sophisticated and accurate your insights—and the more value you bring to stakeholders.
Of course, the two fundamental e-commerce metrics are transactions and revenue; these likely bear no explanation to anyone who’s set foot in e-commerce. However, several more detailed metrics lend themselves to more actionable insights.
- Conversion rate & new visitor conversion rate – Not only can you measure conversion rate, but you can filter our specific channels, audiences, and demographics for comparison.
Maybe you don’t need to optimize your website; perhaps it’s your email marketing that isn’t working. You can tell from this data, and then decide how you want to address that (remember, you can use site components—even something as simple as a landing page) to help optimize other channels.
- Average order value – For real-time monitoring of purchase trends broken down by channel, audience, or demographics, rely on Google Analytics to provide you with data on average order value.
Based on the trends you observe, you might decide to market your offering a bit differently by channel. If that is the cause, you’ll likely set up tests—using events and goal completions.
- Cost per acquisition – This metric is determined by dividing the total spend by the total number of leads generated, telling how much it is costing you to generate a lead in a particular campaign. CPA data helps evaluate the efficacy of PPC advertising, and determine whether certain keywords or ad campaigns are more profitable.
- Exit pages/bounce rates – When a user exits or bounces from your website, they likely lost interest, did not find what they needed or sought to quit shopping with you and look elsewhere.
Understanding where users are bouncing can help you narrow down the problem to a specific product, product characteristic (e.g., pricing), or maybe more evergreen content that turns users away.
- Site search keywords – What are users directly searching for in your site’s search bar? This can be a bit more qualitative of a measure, depending on scale, since smaller sample sizes may not illuminate trends.
Consider why users are searching for these keywords, and what challenges they are facing. Clearly, they are not finding what they need from your site; is this a navigation issue, a content issue, or some other problem?
You can also leverage site search to ideate around new content or keywords to rank for, since site search is a cue around interest.
As you set up your data tracking, avoid falling into the trap of believing that there is one cause for any issues. More likely, you are seeing the convergence of several smaller issues that each need to be addressed separately.
Sync with your CRMs
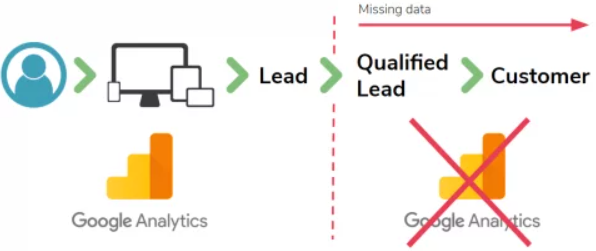
Many businesses have steps in their sales process that cannot be automatically measured in Google Analytics. In fact, unless you run an e-commerce website, some of the key actions towards making a purchase happen off-site. Think of a university where students can apply online (measurable in GA), but must have their application reviewed, work out their financial aid, etc. before actually enrolling (not measurable in GA). The same goes for many B2B or B2C services that generate leads via their website (measurable in GA) but provide a consultation and finalize their sale in person (not measurable in GA).
Although these offline actions are not measurable in Google Analytics, they are still measurable. Businesses in this scenario should have details on their leads, and how many of those leads convert into customers, identifying which leads come through their website or other sources.
Many CRMs like Salesforce and Hubspot offer integrations with Google Analytics. You can incorporate leads or sales data from your CRM into your reporting to help you better understand your bottom line. From plug-ins to API solutions, options are available to help connect your CRM to Google Analytics and attribute leads, and revenue to specific pages or campaigns. Such connections are worthwhile for better understanding the impact of your website.
Find ways to incorporate leads or sales data from your CRM into your reporting to understand the bottom line.
Caveat regarding traffic insights
It’s also important to remember that more traffic does not always translate into more revenue. You can “do everything right” with your SEO and PPC work, and see increases in impressions, clicks, traffic, sessions, events, and even some goal completions, yet still not see increased e-commerce revenue.
Perhaps the product is not meeting the wants and needs of your audience, or the user experience is not ideal, or you are attracting the wrong traffic (people who are not your target audience).
If this is the case, the report will show that conversion rate optimization (CRO) is the issue, rather than a lack of traffic. Events and related metrics like cart abandonment may reveal where attrition occurs.
Always consider all possible variables that may influence trends observed in your data, and then set up tests to measure each one.
Getting the most out of Google Analytics
There is no single perfect metric. Every data type listed here illuminates a different aspect of website visibility and engagement, and must be considered holistically and over an appropriate amount of time.
SEO reporting is not just about assessing the current state of your site but also about understanding the next critical steps to optimize your pages and their content. Data is your guide in your quest for maximum utility and visibility in front of your target audience. Carefully think through the purpose behind each data point you collect and how it connects to your target audience’s journey, and you can set yourself up for maximum success.
Preparing for GA4
As you may have heard, Google Analytics will soon update from Universal Analytics, their previous data model, to Google Analytics 4, a newer method of tracking and reporting that focuses more on engagement metrics. Many of the principles above will still apply, but there will be subtle changes in the naming of metrics and which metrics/dimensions are available. Check back for updates related to this change.