

SEO Reporting: How to Build Meaningful Analytics Reports
If you are interested in a custom dashboard or an Analytics audit and would like our help, please don’t hesitate to contact us.
—
For some agencies, the SEO report is a calling card. Forward-thinking firms rely on APIs and data pipelines to automate reporting and reduce manual effort, while others depend on shallow, fully automated tools that offer little strategic value.
An SEO report should not exist merely to satisfy a client deliverable or meet a monthly internal requirement. It is a strategic instrument. When built correctly, it provides an immediate performance snapshot, highlights emerging risks, and surfaces growth opportunities. A strong SEO report connects data to decision-making—covering organic traffic, rankings, technical health, internal and external link profiles, content performance, and even social visibility—so campaigns can be refined with precision rather than guesswork.
What is an SEO Report, and What Should it Cover?
For those entering the field, an SEO report is commonly used to describe any document that informs the viewer of their website’s SEO status. But creating any report is of no value if the data doesn’t answer important questions.
Here are some essential questions that should be answered quickly and effectively by your SEO report:
- What does the data tell me about our visitors?
- What direction should I take based on the data?
- Why is “X” happening?
- What dubious claims and theories can we correct?
- What campaigns should we renounce, and how can I change direction for the better?
- What data can I use to sell back the SEO investment?
What Metrics Should Be Included in Your Client’s SEO Report?
At Greenlane, our reporting is built on a data-first philosophy, with primary emphasis placed on the KPIs that directly impact business performance. While we include standard metrics such as rankings, traffic, and conversions, our focus is on benchmarking success against the commercial realities of each client’s business model. When a client has not yet defined meaningful KPIs or established SEO-specific goals, we guide them through creating a practical, measurable performance framework.
We prioritize additional data points that provide a more accurate and stable picture of organic performance, including (but not necessarily limited to):
- Organic traffic
- Conversions
- Time on page
- Bounce rate
- Revenue
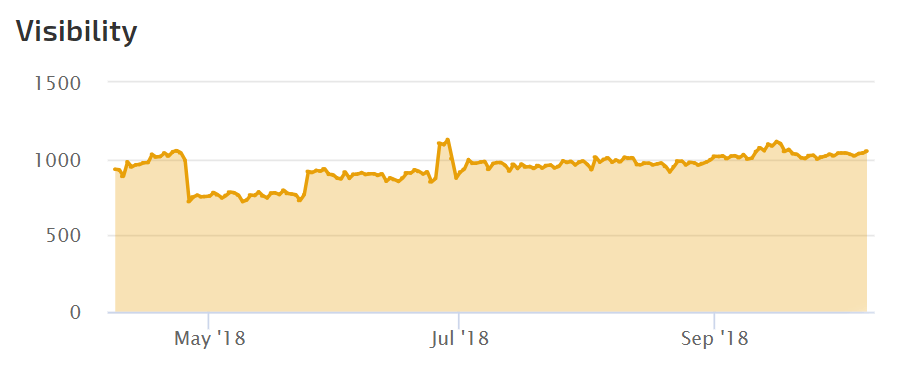
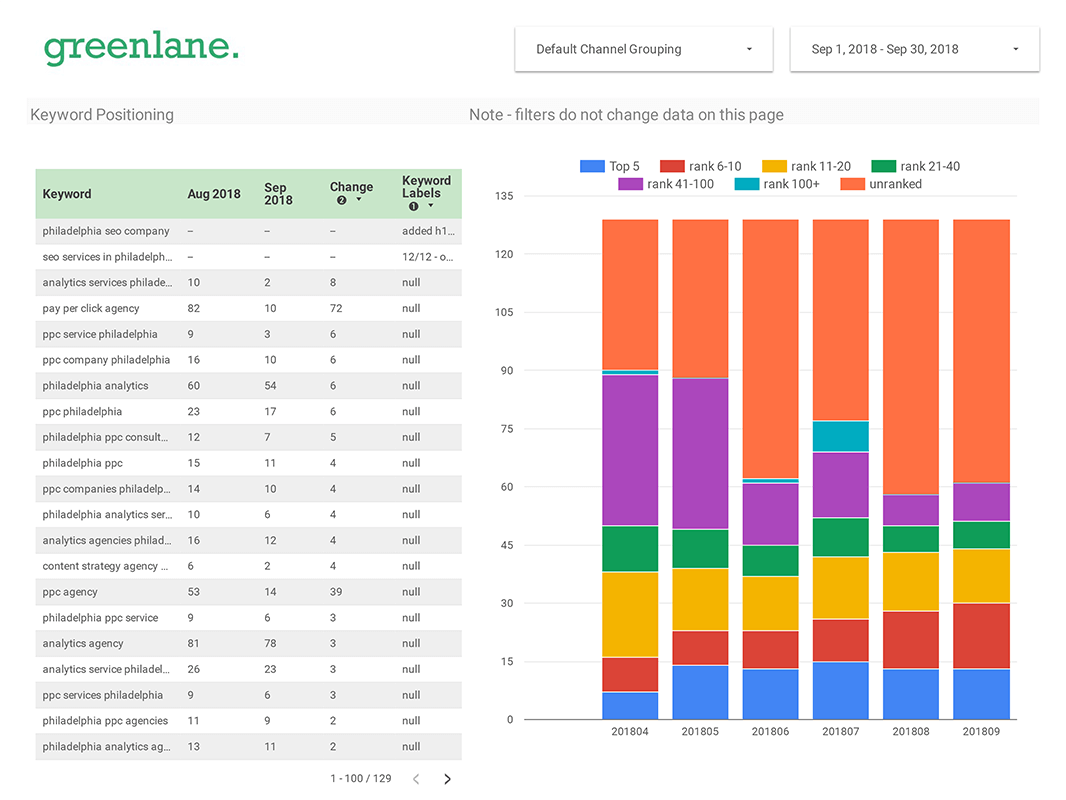
Keyword rankings are never treated as the primary indicator of success. Although ranking reports are common in SEO, rankings alone are a weak performance metric. Search visibility fluctuates constantly. Keywords that typically perform well may temporarily drop on any given day and rebound shortly after. This “ranking dance” can easily distort perceived performance if reports are generated during a short-term dip. A single snapshot may suggest decline where no true regression exists.
Below is a ranking trend for a highly competitive keyword. If this report were made around 9/10/2018, it would look like a victory with a top-10 ranking. In truth, this keyword is not performing well. The report was just focused on a misleading day.
![]()
Instead, you should make sure to reflect the average position. The average position for the keyword above is position 48. This represents organic visibility in a clear and digestible way.
It’s important to group keywords into appropriate landing pages. Instead of thinking of each keyword independently, I prefer an organic visibility score for a page. This allows the target and non-target keywords to represent the website’s traffic. Identify the pages you are working on, and average the ranks for all the keywords driving organic traffic. Repeat each month for a trend.
Different SEO analytics tools offer their own visibility scores using their preferred formula. More than just averages, sometimes traffic and impression data are calculated. Here is a visibility score from Rank Ranger that tells me how well one of my essential pages performs (check out their calculation description). I’d rather learn from this report and drill into each keyword only as needed.
Separate Qualified Traffic within Reports
Qualified traffic is the most valuable metric in any Google Analytics report. The objective is not to increase traffic volume for its own sake, but to attract visitors who take meaningful actions—purchase products, engage with content, submit inquiries, or raise brand awareness. The foundation of qualified organic traffic begins with understanding your highest-value users: their intent, their needs, and the problems they are trying to solve. Every search query represents an expression of intent, and your analytics data reveals these underlying needs. When analyzed properly, organic search data becomes a roadmap for how your website should evolve.
Strong click-through rates and sustained engagement indicate two critical outcomes: your pages are aligned with user intent, and Google has sufficient confidence in your content to continue allocating visibility. Grouping keywords by intent and topic clarifies these performance signals further. A well-constructed SEO report surfaces these patterns, enabling you to identify whether a page should be refined, expanded, or deprioritized in favor of higher-impact initiatives. When pages underperform, the report should not merely reflect the decline—it should diagnose the cause and define the actions required to correct it.
Automate as Much of Your Reporting as Possible
In a past life, I was part of an agency that spent too much time — by hand — downloading Omniture reports (remember them?). I copied and pasted cells, customized charts, ran formulas, and beautified spreadsheets. I could make a spreadsheet look like a work of art, but it wasn’t the work I should have been doing. This exercise took 10+ hours a month, and clients would receive these reports in the middle of the month. Inefficient by today’s standards. I spent far too much time building spreadsheets and needed more time analyzing them. That’s a problem.
Improved technology has given SEOs various methods for accelerating data collection. APIs from Google Analytics and Search Console can plug into Looker Studio or Google Sheets (with a plugin like Supermetrics). This reclaimed time allows us to uncover the stories within the data and transform them into actionable insights that directly inform strategy and execution.
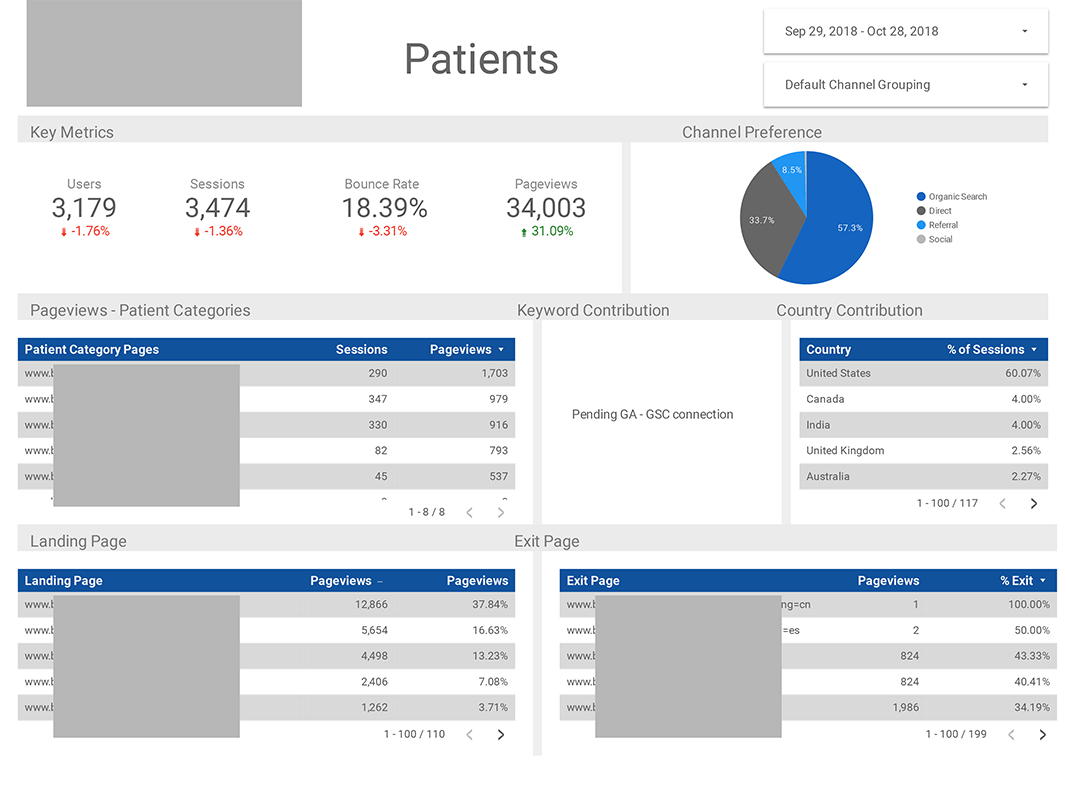
SEO Report Example [with Free Template!]
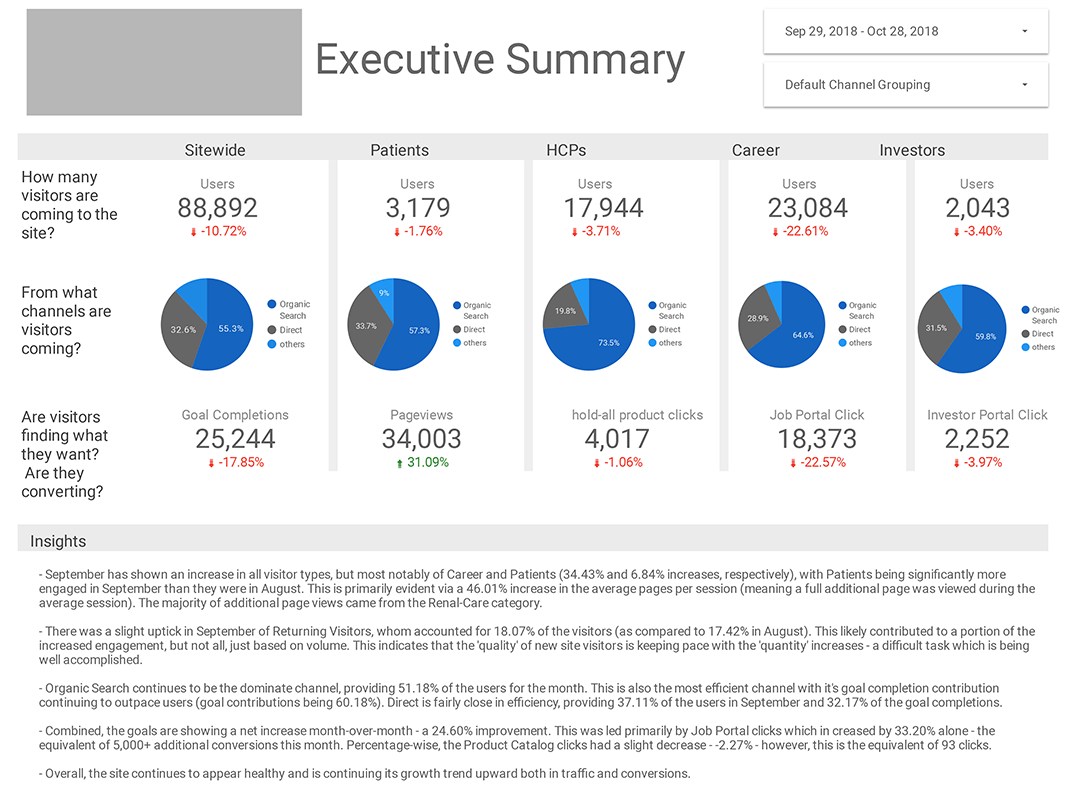
I’ve talked a bit about quality reporting but haven’t yet shown examples of what we do at Greenlane. This is a default SEO status report designed in Looker Studio. It’s our current “out-of-the-box” version (as of this writing). It hasn’t been customized for the client’s KPIs, but it’s clean and clear.
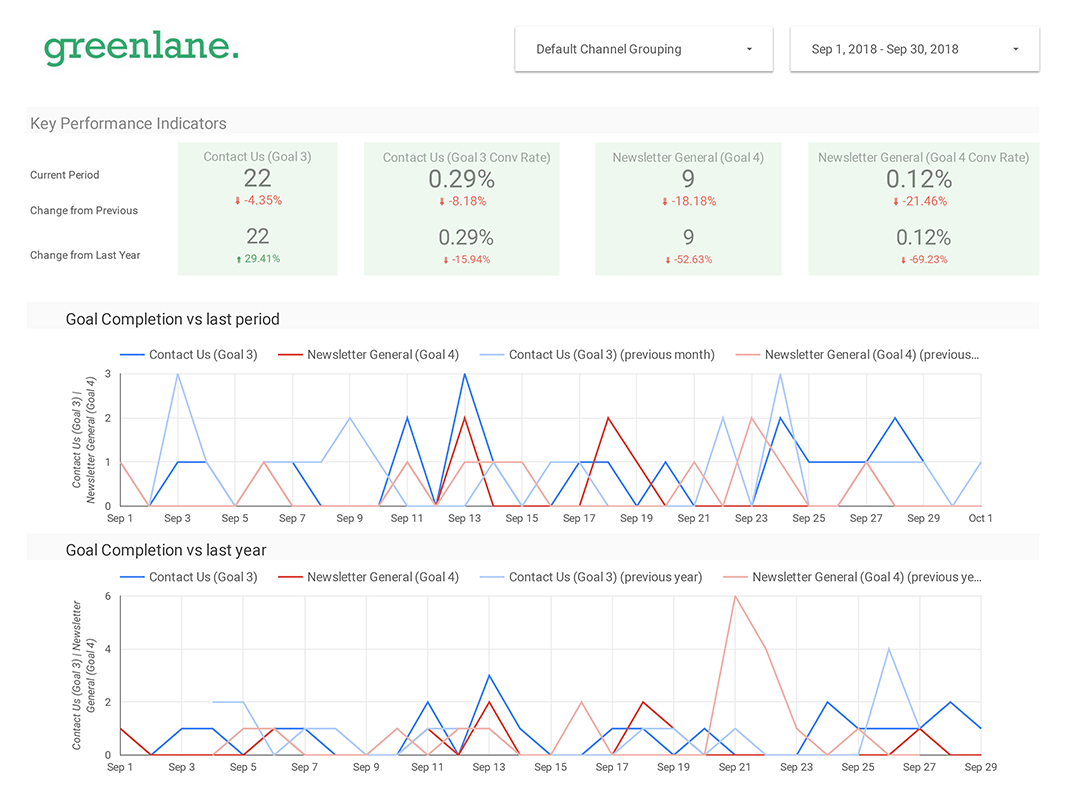
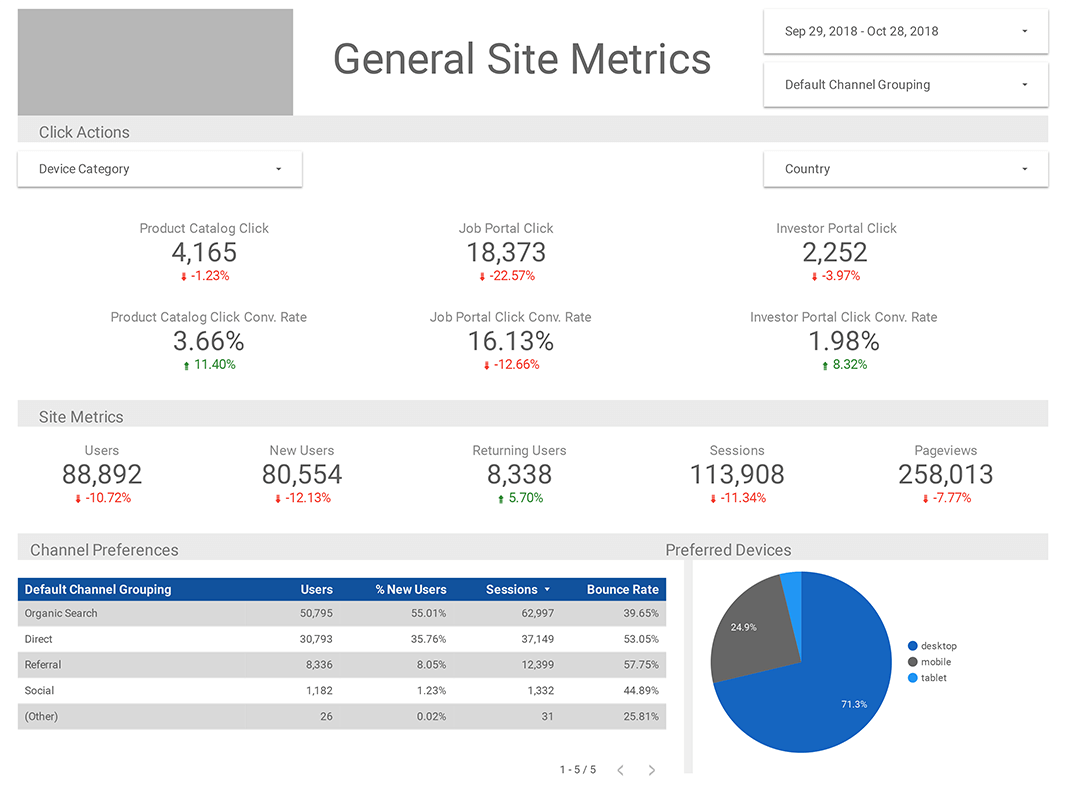
So far, it’s pretty standard stuff. So, what happens when a client has SEO metric requests? You build them in.
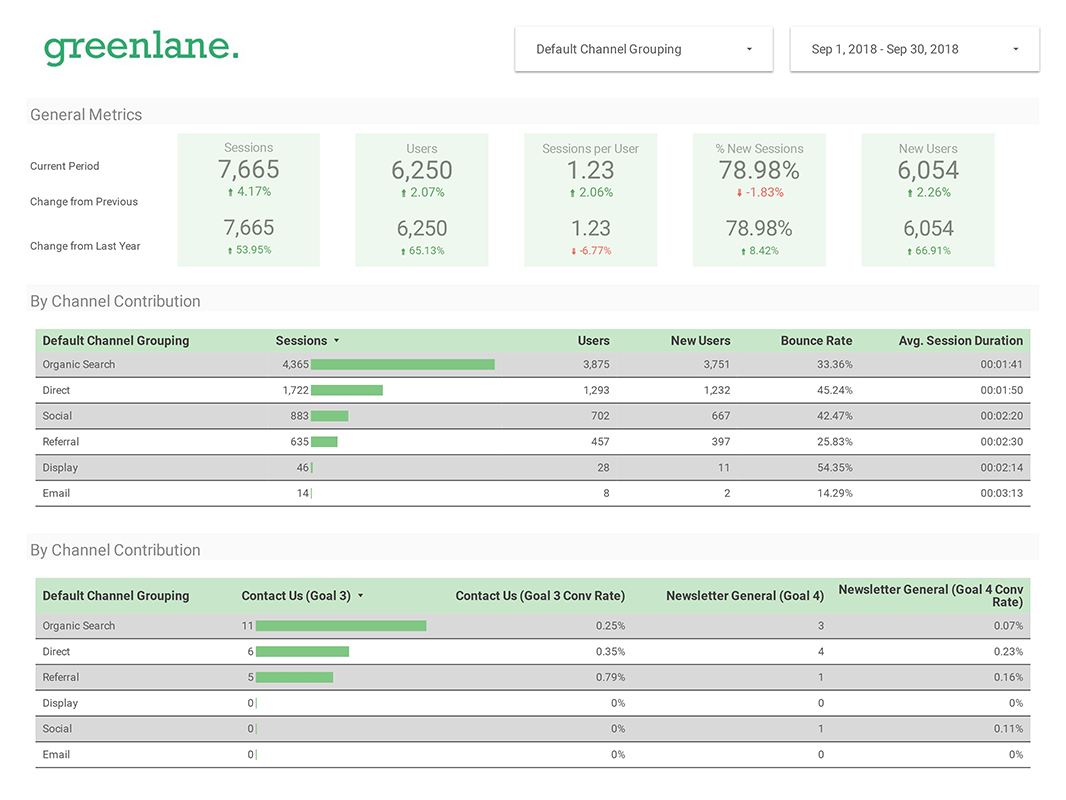
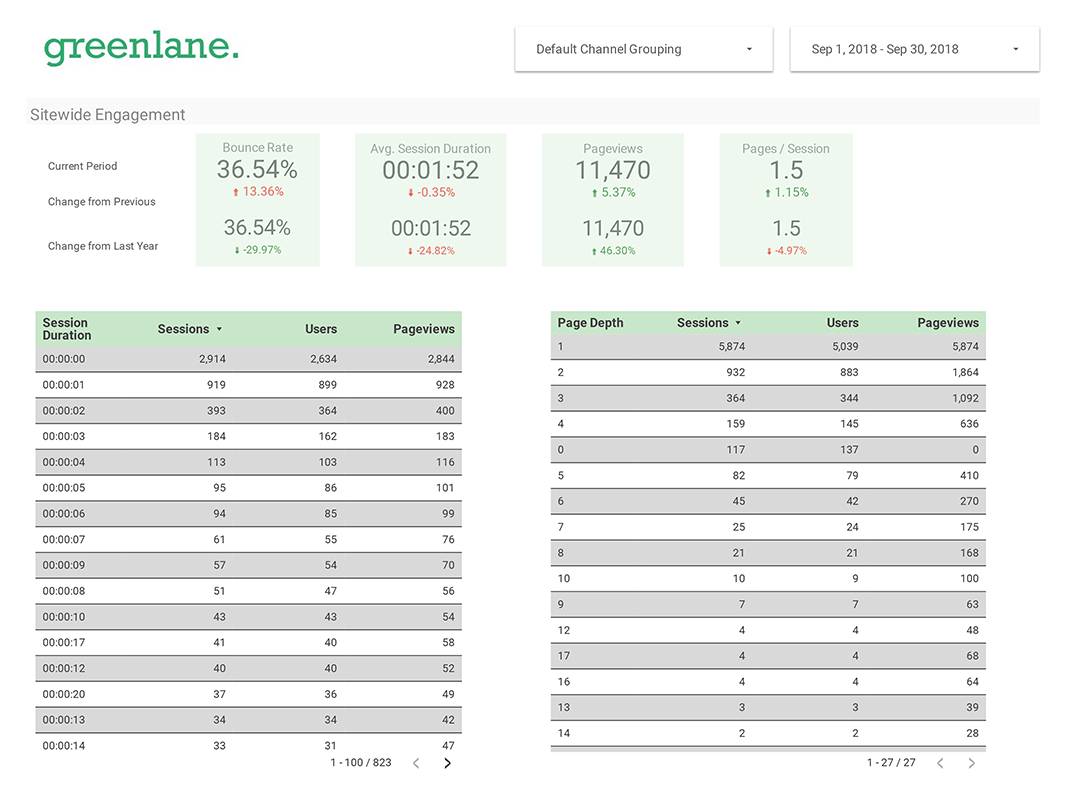
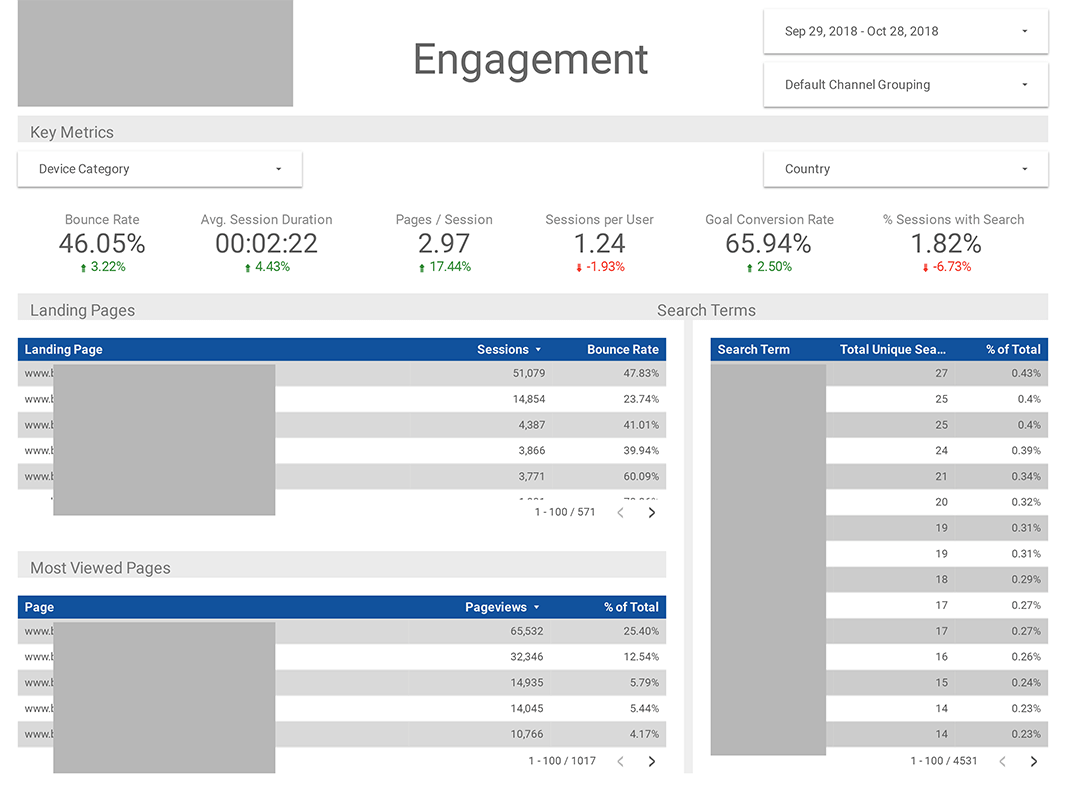
Additionally, in the following example, you’ll see where insights tell the story of the data. The benefit of API-driven reports is that you don’t need to spend time pulling data. They become automated SEO reports. You can use this time to understand what is happening with the site.
There’s no limit to how much customization you can do to your report template. As long as the data is relevant and the insights are valuable, you’re on your way to creating the best SEO reports you can deliver. Developing the template is undoubtedly some upfront work, but it pays off in the long run.
Interested in SEO services? We are a Philadelphia SEO agency supporting clients all over the country. Let’s talk.