
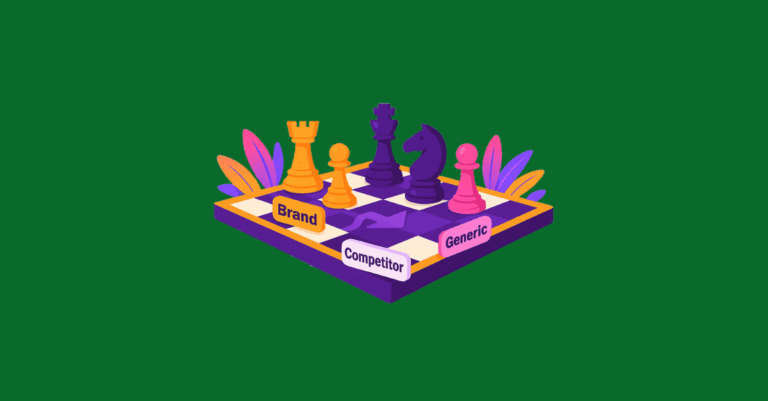
How to Structure Search Campaigns by Intent
Maximize ROI by structuring search campaigns around user intent. Learn how to separate brand, competitor, and generic keywords for smarter bidding and better performance.
Maximize ROI by structuring search campaigns around user intent. Learn how to separate brand, competitor, and generic keywords for smarter bidding and better performance.
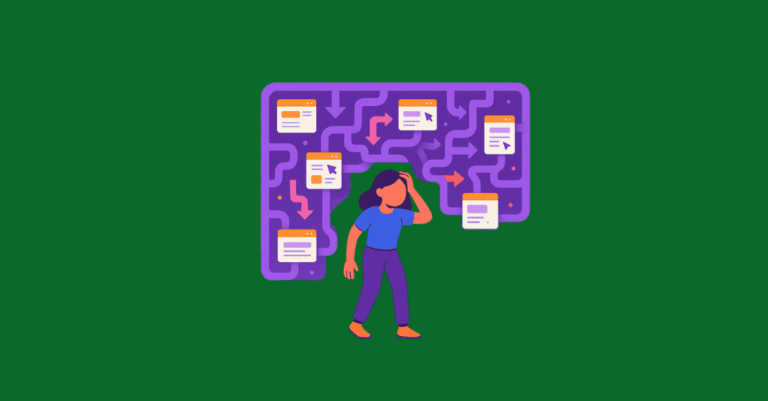
Canonical tags alone won’t fix your duplicate content issues. Learn why Google may ignore them, how they impact traffic and reporting, and what solutions actually work.
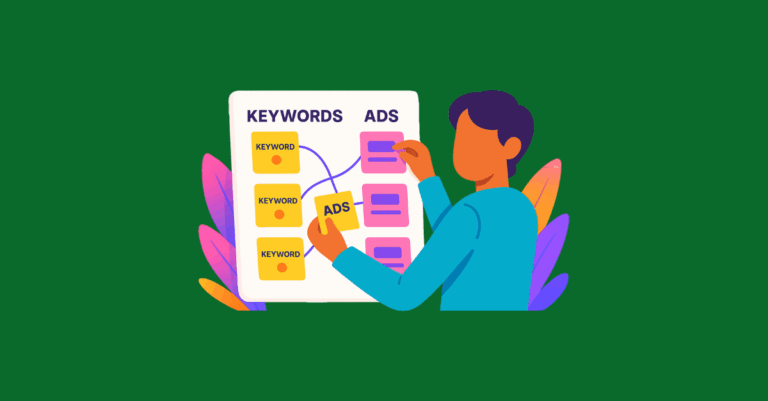
Still using SKAGs in Google Ads? In 2025, they’re killing your performance. Learn why AI-powered features like Smart Bidding and RSAs demand themed ad groups—and how to restructure for better results.

Confused people don’t convert. They scroll past. Enter: knowing your brand’s personality, or “archetypal branding.” Learn more.
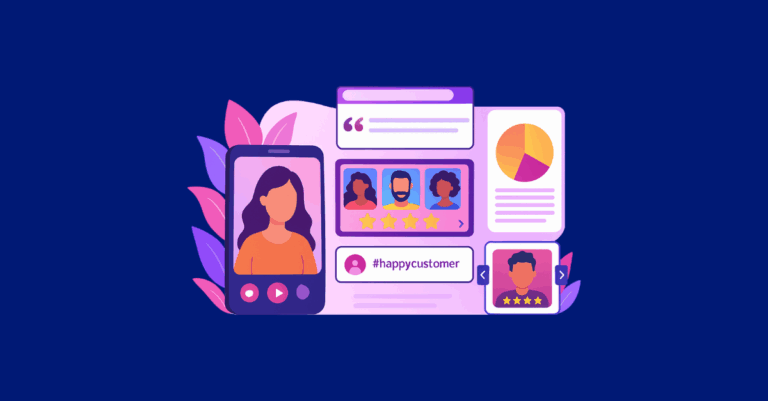
This post explores six high-impact UGC formats and creative ways to turn everyday customer content into scroll-stopping ads across channels.

Think of schema as a notecard or a set of labels we use to explicitly tell search engines what the content is and what it means. Learn more.
Let’s unpack the best ways to add schema markup and walk through some examples of GTM vs. hardcoded implementations.

Social commerce is transforming online shopping by keeping the entire buyer journey on platforms like TikTok and Instagram. Learn how your brand can tap into this shift and boost conversions with Greenlane’s paid media strategies.

See how Google’s March 2025 algorithm update affected local rankings for examined websites across Legal, Health, Finance, Real Estate, Auto, and Travel.

By understanding your ideal customers, you can craft messaging and campaigns that truly resonate with the right target audience.

Learn how to align your SEO strategy with user intent to boost rankings, engagement, and conversions. Break down informational, navigational, commercial, and transactional search intent with actionable strategies and examples.

While AI isn’t a replacement for human expertise, it allows our Paid Media team to work more efficiently and strategically. Here’s how.